ENVIRONMENTALPRODUCT DECLARATIONIN ACCORDANCE WITH ISO 14025 AND EN 15804:A2:2019/AC:2021SmartEPD-2024-044-0202-01Ston�la� URDate of Issue:Oct 30, 2024Expiration:Oct 30, 2029Last up�ate�:Oct 30, 2024

Ston�la� URStonhardPage 2 / 15
Ston�la� URStonhardGeneral Information Stonhard 1000 E. Park Ave., Maple Shade, NJ 08052800.257.7953info@stonhard.comstonhar�.�omPro�u�t Name:Stonclad URDe�lare� Unit:1 kg De�laration Number:SmartEPD-2024-044-0202-01Date of Issue:October 30, 2024Expiration:October 30, 2029Last up�ate�:October 30, 2024EPD S�ope:Cradle to gate with other optionsA1 - A3, A4, A5, C1-C4, D Market(s) of Appli�ability:EuropeReferen�e Stan�ar�sStan�ar�(s):ISO 14025 and EN 15804:2012+A2:2019/AC:2021Core PCR:EPD International PCR for Construction Products 2019:14 (EN 15804:A2:2019/AC:2021) v1.3.2 v.1.3.2Date of issue: December 08, 2023Valid until: December 20, 2024Sub-�ategory PCR review panel:Contact Smart EPD for more information.General Program Instru�tions:Smart EPD General Program Instructions v.1.0, November 2022Page 3 / 15

Ston�la� URStonhardVerifi�ation InformationLCA Author/Creator:Juan David Villegasjuan@parqhq.comEPD Program Operator:Smart EPDinfo@smartepd.comwww.smartepd.com585 Grove St., Ste. 145 PMB 966, Herndon, VA 20170, USAVerifi�ation: Independent critical review of the LCA and data, according to ISO 14044 and ISO 14071 : External Ranjani TheregowdaSmart EPD LLCranjani.theregowda@smartepd.com Independent external verification of EPD, according to ISO 14025 and reference PCR(s) : External Ranjani TheregowdaSmart EPD LLCranjani.theregowda@smartepd.comLimitations, Liability, an� OwnershipEnvironmental declarations from different programs (ISO 14025) may not be comparable. Comparison of the environmental performance of products using EPD information shall be based on the product’s use and impacts at the building level, and therefore EPDs may not be used for comparability purposes when not considering the whole building life cycle. EPD comparability is only possible when all stages of a life cycle have been considered. However, variations and deviations are possible. Example of variations: Different LCA software and background LCI datasets may lead to differences results for upstream or downstream of the life cycle stages declared. The EPD owner has sole ownership, liability, and responsibility for the EPD.Organization Information Stonhard is committed to manufacturing and installing quality, seamless products that protect, maintain and enhance industrial and commercial environments. We maintain a global leadership position in the marketplace with the support of those who stand behind the Stonhard name, and who passionately believe that success happens because of the people who make it happen. Further information �an be foun� at:www.stonhar�.�omPro�u�t Des�ription Stonclad UR is a four-component, trowel applied, polyurethane mortar system. Stonclad UR onsists of a urethane-urea binder, pigments, and graded quartz aggregates. Stonclad UR can be applied at thickness ranging from 3 mm to 6 mm depending on application requirements. Stonclad UR is a high impact resistant mortar which exhibits excellent abrasion, thermal shock, thermal cycling and chemical resistant characteristics making it ideal for the food and beverage industry as well as any other applications requiring these properties. Further information �an be foun� at:https://www.stonhar�.�om/pro�u�ts/ston�la�Pro�u�t InformationDe�lare� Unit:1 kg Mass:1 kgPage 4 / 15
Ston�la� URStonhardPro�u�t Spe�ifi�ity:Product AverageProduct SpecificPlantsStonhard AlgheroAlghero, Sassari, ItalyStonhard NuremburgNuremberg, GermanyStonhard BarcelonaBarcelona, SpainPro�u�t Spe�ifi�ationsPro�u�t SKU(s):IS-7,3199PL,01230-EUR,01260-EURPro�u�t Classifi�ation Co�es:EC3 - Finishes -> Flooring -> OtherFlooringMaterial CompositionMaterial/Component CategoryOrigin% MassCrosslinking agentITA<10%PlasticizerDEU,BEL,USA,ITA<10%Stabilizing agentITA<10%DefoamerITA<10%Filler, extenderDEU,ESP90% - 100%Neutralizing agentDEU<10%Pigment ESP<10%Packaging MaterialOriginkg Massplastic pailEUR0.007cardboardEUR0.0135foilEUR0.0025Page 5 / 15
Ston�la� URStonhardBiogenic Carbon Contentkg C per kgBiogenic carbon content in productNoneBiogenic carbon content in accompanying packaging0.01Hazardous MaterialsDiphenylmethane-diisocyanate, isomers and homologues (9016-87-9)quartz (silicon dioxide) (14808-60-7)portland cement (65997-15-1)calcium hydroxide (1305-62-0)4,4'-methylenediphenyl diisocyanate (101-68-8)EPD Data Spe�ifi�ityPrimary Data Year:2023-2024Manufa�turing Spe�ifi�ity:Industry AverageManufacturer AverageFacility SpecificAveraging:Averaging was not conducted for this EPDSoftware an� LCI Data Sour�esLCA Software:SimaPro v. 9.5LCI Foregroun� Database(s):Ecoinvent v. 3.9.1LCI Ba�kgroun� Database(s):Ecoinvent v. 3.9.1Renewable Ele�tri�ityEnergy Attribute Certifi�ates (EACs) su�h as Re-newable Energy Certifi�ates (RECs) or Power Pur-�hase Agreements (PPAs) are in�lu�e� in the baseline reporte� results:NoPage 6 / 15
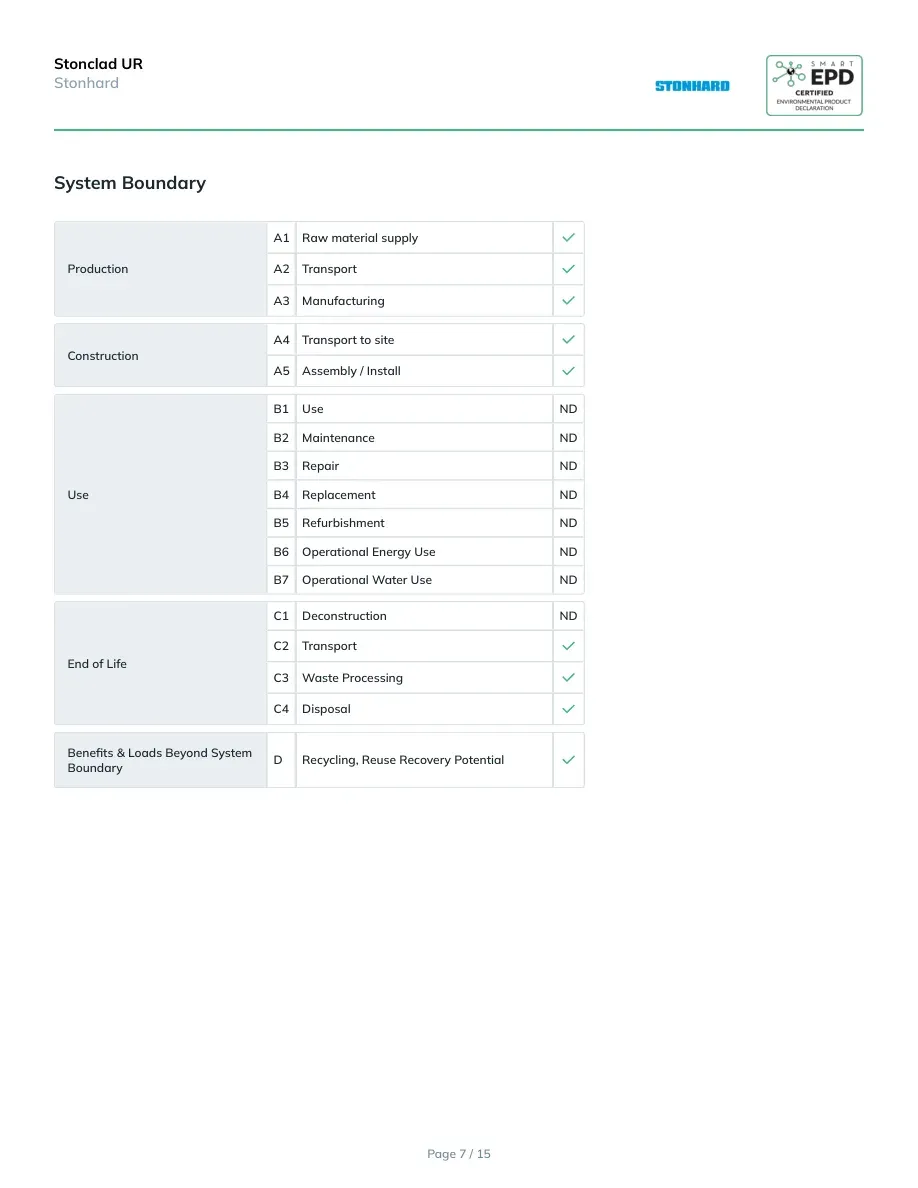
Ston�la� URStonhardSystem Boun�aryProductionA1Raw material supplyA2TransportA3ManufacturingConstructionA4Transport to siteA5Assembly / InstallUseB1UseNDB2MaintenanceNDB3RepairNDB4ReplacementNDB5RefurbishmentNDB6Operational Energy UseNDB7Operational Water UseNDEnd of LifeC1DeconstructionNDC2TransportC3Waste ProcessingC4DisposalBenefits & Loads Beyond System BoundaryDRecycling, Reuse Recovery PotentialPage 7 / 15
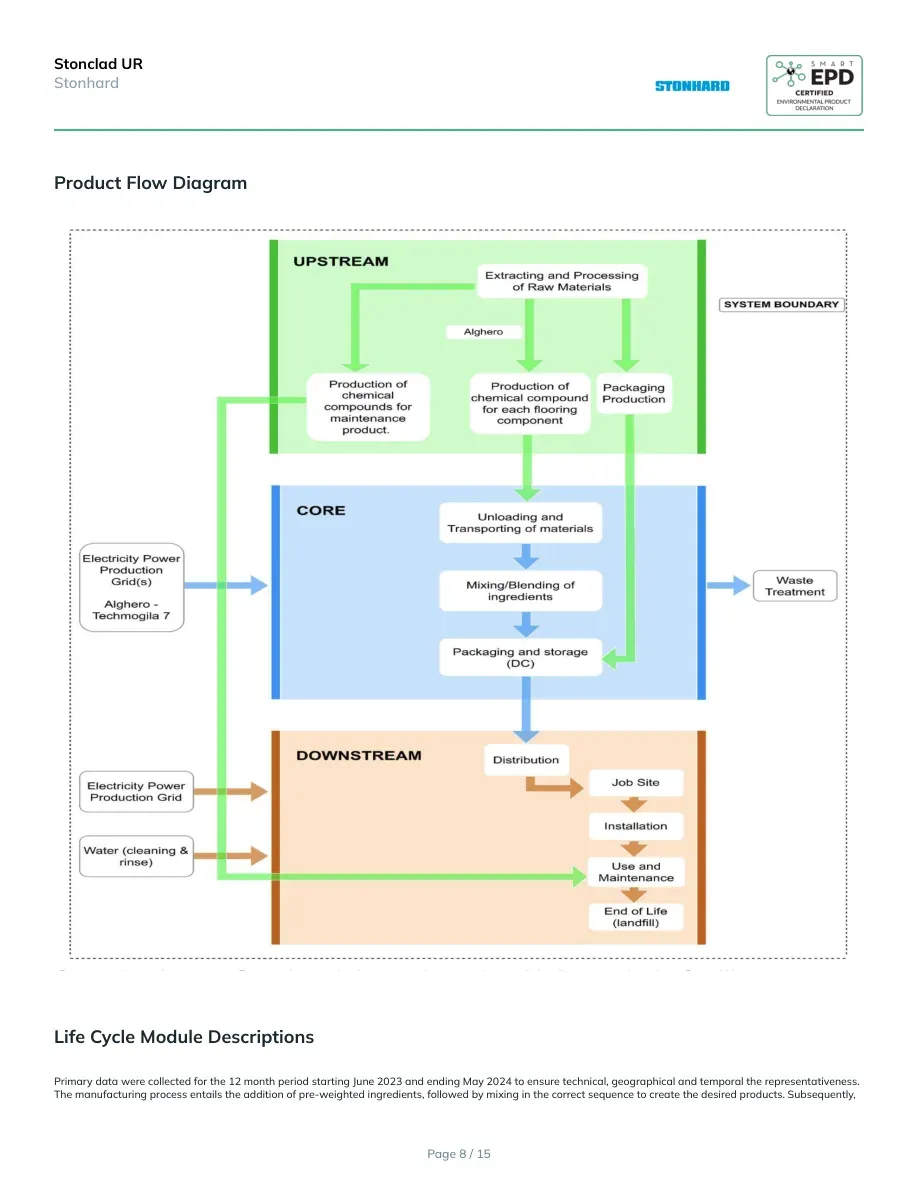
Ston�la� URStonhardPro�u�t Flow DiagramLife Cy�le Mo�ule Des�riptionsPrimary data were collected for the 12 month period starting June 2023 and ending May 2024 to ensure technical, geographical and temporal the representativeness. The manufacturing process entails the addition of pre-weighted ingredients, followed by mixing in the correct sequence to create the desired products. Subsequently, Page 8 / 15
Ston�la� URStonhardpackages and distributes the finished products to various distribution centers. The process involves the use of grid electricity, energy from natural diesel combustion, an process water. Non hazardous waste consisting mainly of packaging material is sent to disposal or recycling.LCA Dis�ussionAllo�ation Pro�e�ureAllocation of co-products was avoided, to the extent it was possible, based on the guidance given in ISO 14044:2006, 4.3., in EN 15804+A2:2019 and section 4.5.1 of Construction Products PCR 2019:14 version 1.3.4. Mass allocation was applied to energy and water use at the facility level. Waste allocation followed the polluter pays principle as indicated in section 4.5.2 of the PCR. Total product mass produced at each facility was provided.Cut-off Pro�e�ureNo cut-off criteria are defined for this study. The system boundary was defined based on relevance to the goal of the study. For the processes within the system boundary, all available energy and material flow data have been included in the model. In cases where no matching life cycle inventories are available to represent a flow, proxy data have been applied based on conservative assumptions regarding environmental impacts.Data Quality Dis�ussionThe quality of inventory data is evaluated based on several criteria, including precision, completeness, consistency, and representativeness.Precision and Completeness• Precision: The inventory data used in this study were either directly measured, calculated, or estimated based on primary data sources, ensuring high precision. Background data from ecoinvent v3.9.1 database also has documented precision to the extent available.• Completeness: The product system's mass balance and inventory completeness were thoroughly checked. Some exclusions were made in line with the PCR requirements, such as personnel impacts, R&D activities, business travel, secondary packaging, point of sale infrastructure, and the coating applicator. However, no data was intentionally omitted..Consistency and Reproducibility• Consistency: Primary data were collected with a similar level of detail, while background data came from the ecoinvent v3.9.1 database. The modeling approach and other methodological choices were applied consistently throughout the model. Default values from the PCR were considered where there was unavailability of primary data, For example, the default waste transport distance was used for product disposal assessment.• Reproducibility: This study ensures reproducibility by providing comprehensive disclosure of input-output data, dataset choices, and modeling approaches. A knowledgeable third party should be able to approximate the results using the same data and modeling methods.Representativeness• Temporal: Primary data were collected for the 12 month period starting June 2023 and ending in May 2024 to ensure the representativeness of post-consumer content. Secondary data from the ecoinvent v3 database is typically representative of recent years. to ensure the representativeness of post-consumer content. Secondary data from the ecoinvent v3 database is typically representative of recent years.• Geographical: Primary data represent Stonhard's production facilities. Where applicable, differences in electric grid mix were considered using appropriate secondary data. The use of country-specific data ensures high geographical representativeness, and proxy data were only used when country-specific data were unavailable.• Technological: Both primary and secondary data were tailored to the specific technologies studied, ensuring high technological representativeness.Page 9 / 15
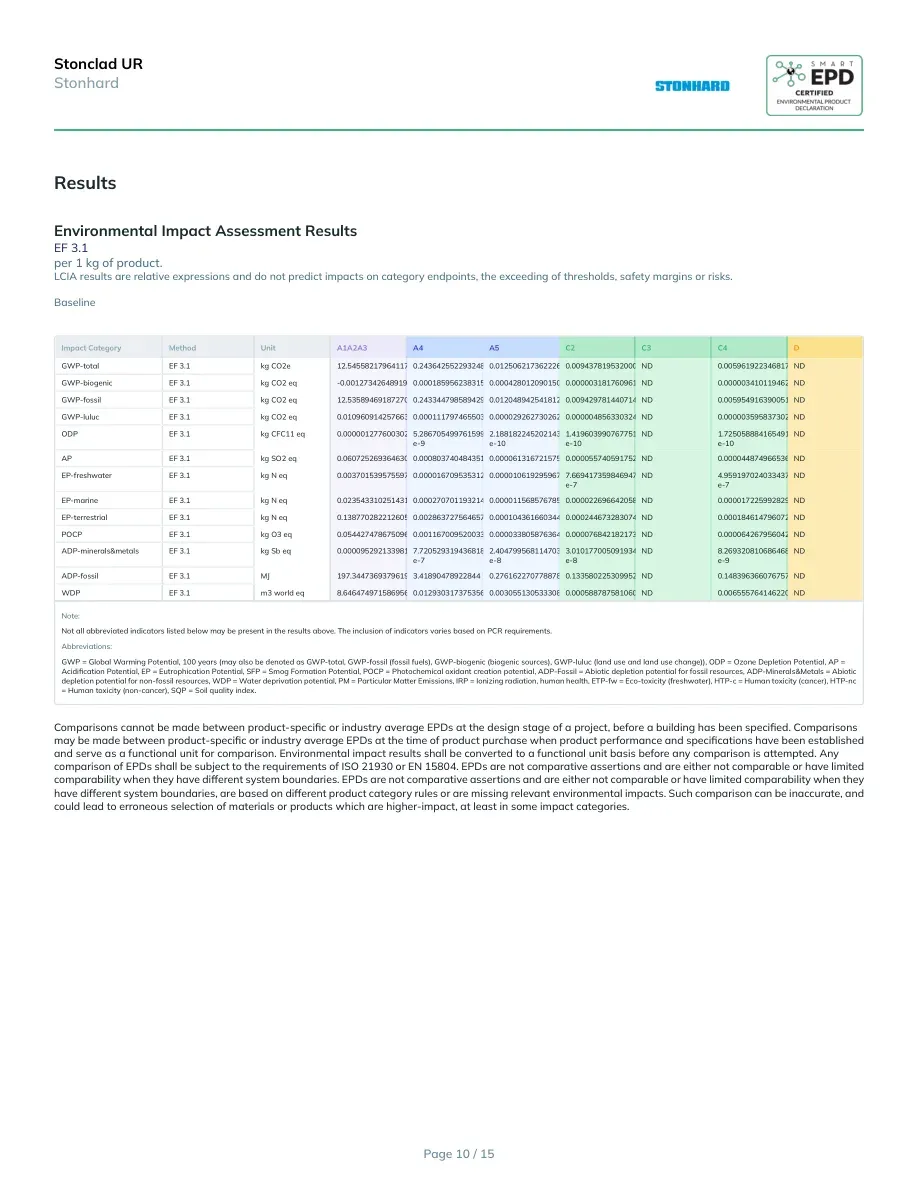
Ston�la� URStonhardResultsEnvironmental Impa�t Assessment ResultsEF 3.1per 1 kg of product.LCIA results are relative expressions and do not predict impacts on category endpoints, the exceeding of thresholds, safety margins or risks.BaselineImpa�t CategoryMetho�UnitA1A2A3A4A5C2C3C4DGWP-totalEF 3.1kg CO2e12.5455821796411780.243642552293248240.0125062173622261020.009437819532000494ND0.005961922346817668NDGWP-biogenicEF 3.1kg CO2 eq-0.00127342648919514380.000185956238315536230.000428012090150893070.0000031817609619683856ND0.0000034101194627792257NDGWP-fossilEF 3.1kg CO2 eq12.5358946918727070.243344798589429030.0120489425418129970.009429781440714288ND0.005954916390051994NDGWP-lulucEF 3.1kg CO2 eq0.0109609142576635490.000111797465503680770.0000292627302622128780.000004856330324237135ND0.0000035958373028925906NDODPEF 3.1kg CFC11 eq0.00000127760030298049565.286705499761599-e-92.1881822452021434-e-101.4196039907677515-e-10ND1.725058884165491-e-10NDAPEF 3.1kg SO2 eq0.060725269364630190.00080374048435143380.000061316721575754490.000055740591752798745ND0.00004487496653640341NDEP-freshwaterEF 3.1kg N eq0.00370153957559743450.0000167095353127852680.0000106192959674252747.669417359846947-e-7ND4.959197024033437-e-7NDEP-marineEF 3.1kg N eq0.0235433102514316930.00027070119321440980.0000115685767856945640.000022696642058874415ND0.00001722599282960461NDEP-terrestrialEF 3.1kg N eq0.138770282212605840.0028637275646572310.000104361660344759230.0002446732830740762ND0.00018461479607278204NDPOCPEF 3.1kg O3 eq0.054427478675096370.00116700952003305510.000033805876364972750.00007684218217326564ND0.00006426795604270655NDADP-minerals&metalsEF 3.1kg Sb eq0.000095292133981698597.720529319436818-e-72.4047995681147033-e-83.010177005091934-e-8ND8.269320810686468-e-9NDADP-fossilEF 3.1MJ197.3447369379619 3.418904789228440.27616227077887810.13358022530995217ND0.148396366076757 NDWDPEF 3.1m3 world eq8.646474971586956 0.0129303173753561870.00305513053330875360.0005887875810605506ND0.006555764146220483NDNote:Not all abbreviated indicators listed below may be present in the results above. The inclusion of indicators varies based on PCR requirements.Abbreviations:GWP = Global Warming Potential, 100 years (may also be denoted as GWP-total, GWP-fossil (fossil fuels), GWP-biogenic (biogenic sources), GWP-luluc (land use and land use change)), ODP = Ozone Depletion Potential, AP = Acidification Potential, EP = Eutrophication Potential, SFP = Smog Formation Potential, POCP = Photochemical oxidant creation potential, ADP-Fossil = Abiotic depletion potential for fossil resources, ADP-Minerals&Metals = Abiotic depletion potential for non-fossil resources, WDP = Water deprivation potential, PM = Particular Matter Emissions, IRP = Ionizing radiation, human health, ETP-fw = Eco-toxicity (freshwater), HTP-c = Human toxicity (cancer), HTP-nc = Human toxicity (non-cancer), SQP = Soil quality index.Comparisons cannot be made between product-specific or industry average EPDs at the design stage of a project, before a building has been specified. Comparisons may be made between product-specific or industry average EPDs at the time of product purchase when product performance and specifications have been established and serve as a functional unit for comparison. Environmental impact results shall be converted to a functional unit basis before any comparison is attempted. Any comparison of EPDs shall be subject to the requirements of ISO 21930 or EN 15804. EPDs are not comparative assertions and are either not comparable or have limited comparability when they have different system boundaries. EPDs are not comparative assertions and are either not comparable or have limited comparability when they have different system boundaries, are based on different product category rules or are missing relevant environmental impacts. Such comparison can be inaccurate, and could lead to erroneous selection of materials or products which are higher-impact, at least in some impact categories.Page 10 / 15
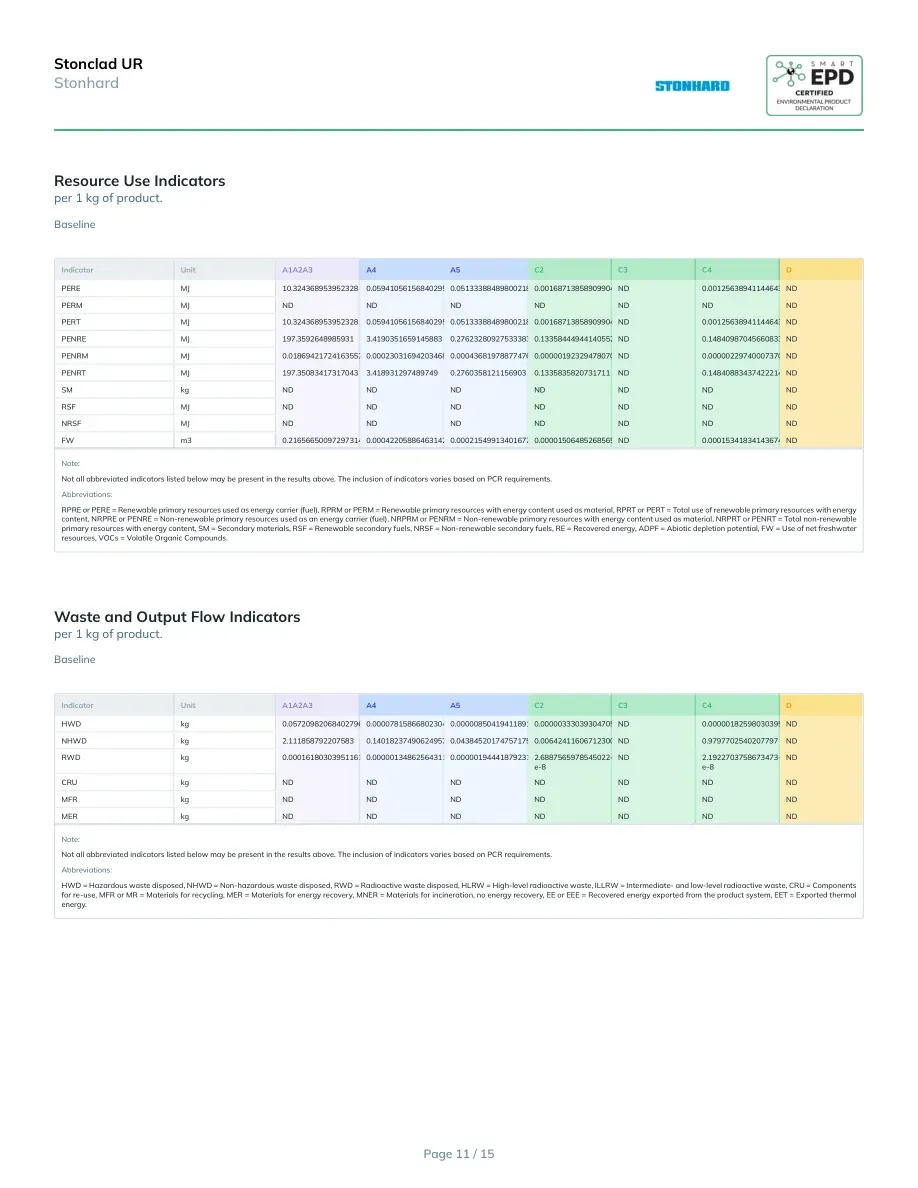
Ston�la� URStonhardResour�e Use In�i�atorsper 1 kg of product.BaselineIn�i�atorUnitA1A2A3A4A5C2C3C4DPEREMJ10.3243689539523280.05941056156840295 0.05133388489800218 0.0016871385890990494ND0.0012563894114464348NDPERMMJNDNDNDNDNDNDNDPERTMJ10.3243689539523280.05941056156840295 0.05133388489800218 0.0016871385890990494ND0.0012563894114464348NDPENREMJ197.35926489859313.41903516591458830.27623280927533383 0.13358444944140552 ND0.14840987045660833 NDPENRMMJ0.0186942172416355750.00023031694203468260.000436819788774763030.0000019232947807040546ND0.0000022974000737008282NDPENRTMJ197.350834173170433.4189312974897490.27603581211569030.1335835820731711ND0.14840883437422214 NDSMkgNDNDNDNDNDNDNDRSFMJNDNDNDNDNDNDNDNRSFMJNDNDNDNDNDNDNDFWm30.21656650097297314 0.00042205886463142340.000215499134016777430.000015064852685657247ND0.00015341834143674143NDNote:Not all abbreviated indicators listed below may be present in the results above. The inclusion of indicators varies based on PCR requirements.Abbreviations:RPRE or PERE = Renewable primary resources used as energy carrier (fuel), RPRM or PERM = Renewable primary resources with energy content used as material, RPRT or PERT = Total use of renewable primary resources with energy content, NRPRE or PENRE = Non-renewable primary resources used as an energy carrier (fuel), NRPRM or PENRM = Non-renewable primary resources with energy content used as material, NRPRT or PENRT = Total non-renewable primary resources with energy content, SM = Secondary materials, RSF = Renewable secondary fuels, NRSF = Non-renewable secondary fuels, RE = Recovered energy, ADPF = Abiotic depletion potential, FW = Use of net freshwater resources, VOCs = Volatile Organic Compounds.Waste an� Output Flow In�i�atorsper 1 kg of product.BaselineIn�i�atorUnitA1A2A3A4A5C2C3C4DHWDkg0.05720982068402796 0.000078158668023041390.000008504194118911440.0000033303930470518496ND0.0000018259803039599731NDNHWDkg2.1118587922075830.14018237490624957 0.0438452017475717550.006424116067123009ND0.9797702540207797NDRWDkg0.00016180303951161550.0000013486256431148610.0000019444187923155972.6887565978545022-e-8ND2.1922703758673473-e-8NDCRUkgNDNDNDNDNDNDNDMFRkgNDNDNDNDNDNDNDMERkgNDNDNDNDNDNDNDNote:Not all abbreviated indicators listed below may be present in the results above. The inclusion of indicators varies based on PCR requirements.Abbreviations:HWD = Hazardous waste disposed, NHWD = Non-hazardous waste disposed, RWD = Radioactive waste disposed, HLRW = High-level radioactive waste, ILLRW = Intermediate- and low-level radioactive waste, CRU = Components for re-use, MFR or MR = Materials for recycling, MER = Materials for energy recovery, MNER = Materials for incineration, no energy recovery, EE or EEE = Recovered energy exported from the product system, EET = Exported thermal energy.Page 11 / 15
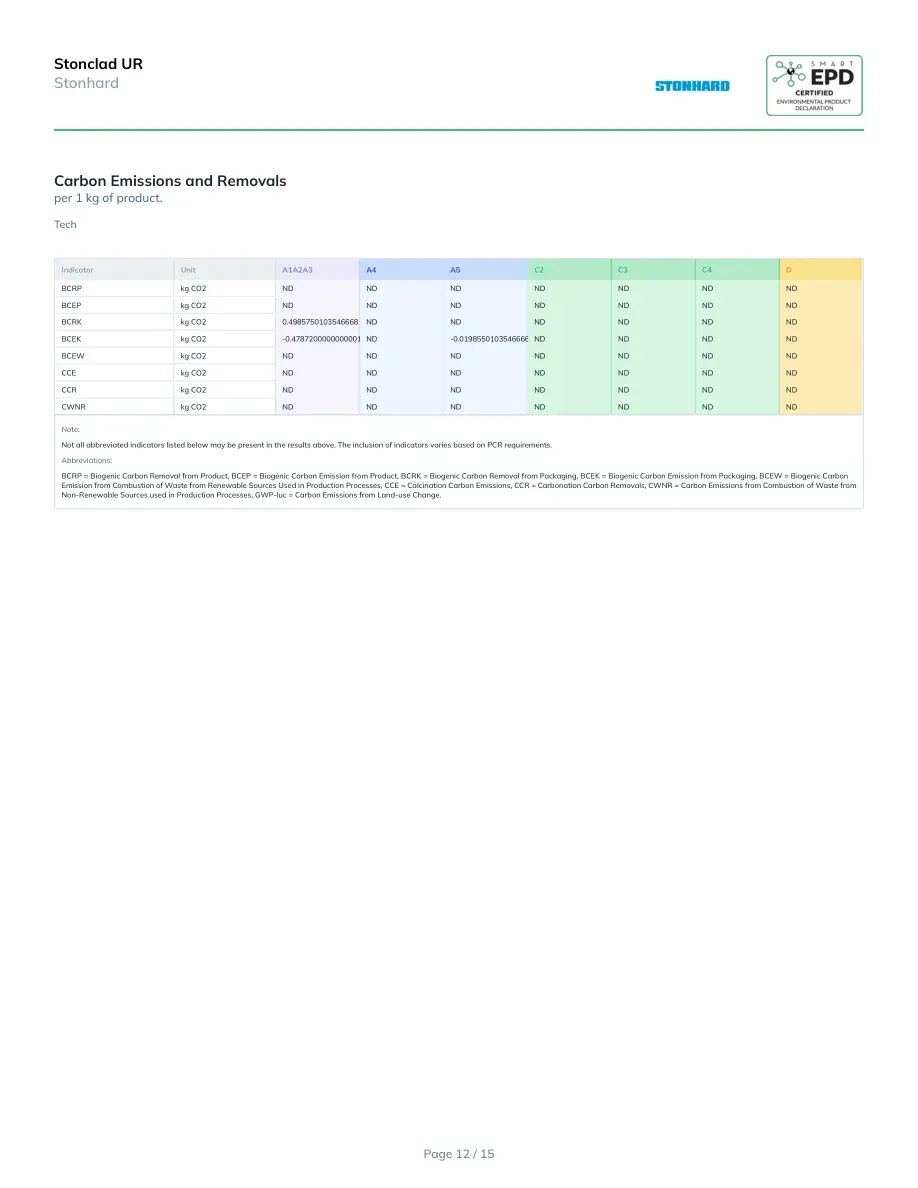
Ston�la� URStonhardCarbon Emissions an� Removalsper 1 kg of product.TechIn�i�atorUnitA1A2A3A4A5C2C3C4DBCRPkg CO2NDNDNDNDNDNDNDBCEPkg CO2NDNDNDNDNDNDNDBCRKkg CO20.4985750103546668NDNDNDNDNDNDBCEKkg CO2-0.4787200000000001 ND-0.01985501035466667NDNDNDNDBCEWkg CO2NDNDNDNDNDNDNDCCEkg CO2NDNDNDNDNDNDNDCCRkg CO2NDNDNDNDNDNDNDCWNRkg CO2NDNDNDNDNDNDNDNote:Not all abbreviated indicators listed below may be present in the results above. The inclusion of indicators varies based on PCR requirements.Abbreviations:BCRP = Biogenic Carbon Removal from Product, BCEP = Biogenic Carbon Emission from Product, BCRK = Biogenic Carbon Removal from Packaging, BCEK = Biogenic Carbon Emission from Packaging, BCEW = Biogenic Carbon Emission from Combustion of Waste from Renewable Sources Used in Production Processes, CCE = Calcination Carbon Emissions, CCR = Carbonation Carbon Removals, CWNR = Carbon Emissions from Combustion of Waste from Non-Renewable Sources used in Production Processes, GWP-luc = Carbon Emissions from Land-use Change. Page 12 / 15
Ston�la� URStonhardS�enariosTransport to the buil�ing/�onstru�tion site (A4)A4 ModuleFuel Type:DieselVehi�le Type:Truck and TrailerTransport Distan�e:1.007e+03 kmCapa�ity Utilization:33 %Pa�kaging Mass:2.299e-02 kgGross �ensity of pro�u�ts transporte�:2.450e+03 kg/m3Weight of pro�u�ts transporte�:1.000e+00 kgVolume of pro�u�ts transporte�:4.082e-04 m3Capa�ity utilization volume fa�tor:1Assumptions for s�enario �evelopment:Transport distance includes finished product to distribution center and distribution center to point of sale.Installation in to the buil�ing/�onstru�tion site (A5)A5 ModulePro�u�t Lost per Fun�tional Unit:0.1 kgMass of Pa�kaging Waste Spe�ifie� by Type:0.0985 kgVOC Emissions:239000000000 ug/m3VOC Assumptions:The VOC content reported in this EPD is a conservative estimated value and may not accurately represent the actual VOC emissions during the coating's curing process after installation. It is provided for informational purposes only and should not be used as a direct indicator of emissions under actual use conditionsEn� of LifeC1 - C4 ModulesCollection ProcessColle�te� with Mixe� Constru�tion Waste:1 kgRecoveryLan�fill:1 kgInterpretation• The manufacturing of the products in this analysis involves the direct procurement of raw materials from suppliers. These materials are then transported to manufacturing facilities in Europe where they are stored and mixed to produce the coatings. Notably, the product stage (stage 1) has the highest impact contribution, mainly attributed to the combined environmental impacts associated with raw material manufacturing and energy used in manufacturing.• For products with significant manufacturing energy impacts, the shift to renewable energy sources is recommended.•Page 13 / 15
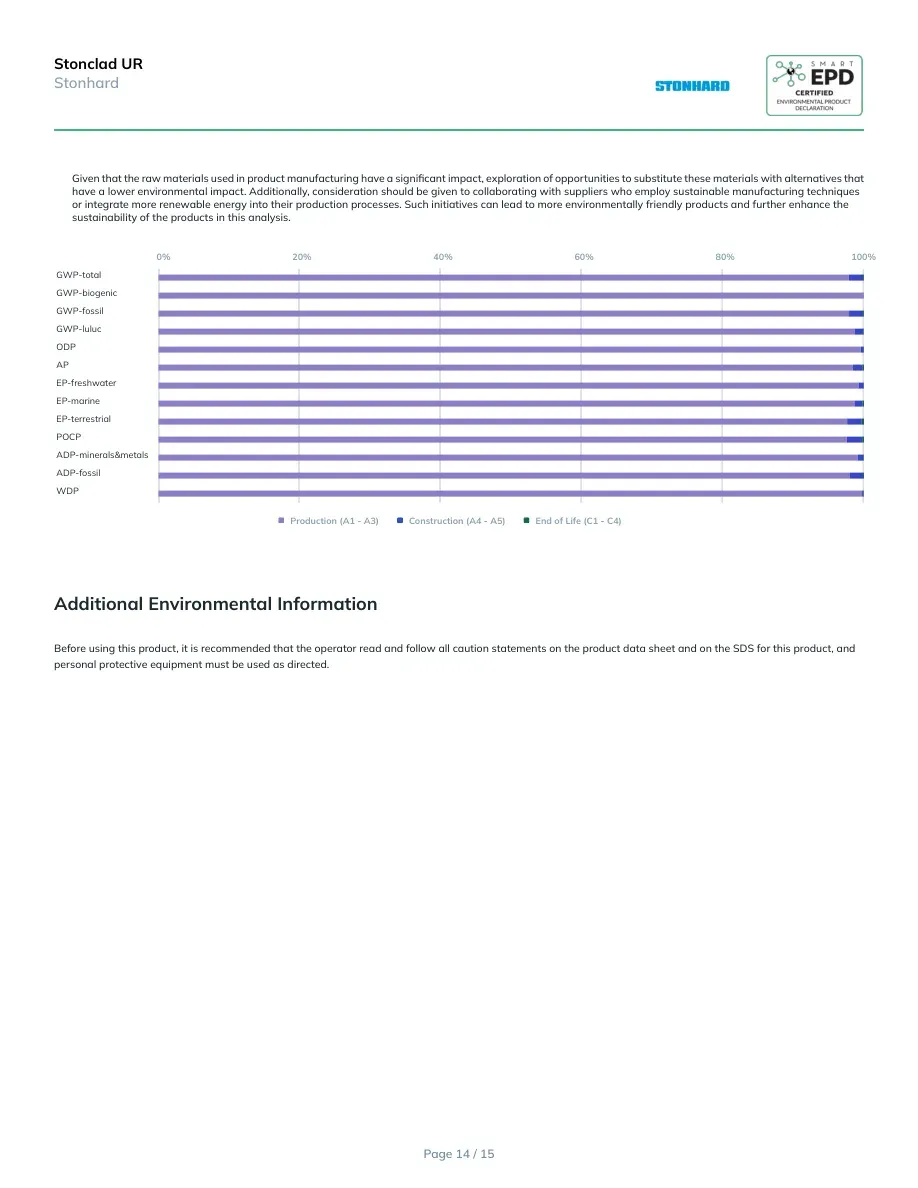
Ston�la� URStonhardGiven that the raw materials used in product manufacturing have a significant impact, exploration of opportunities to substitute these materials with alternatives that have a lower environmental impact. Additionally, consideration should be given to collaborating with suppliers who employ sustainable manufacturing techniques or integrate more renewable energy into their production processes. Such initiatives can lead to more environmentally friendly products and further enhance the sustainability of the products in this analysis.0%20%40%60%80%100% GWP-total GWP-biogenic GWP-fossil GWP-luluc ODP AP EP-freshwater EP-marine EP-terrestrial POCP ADP-minerals&metals ADP-fossil WDP Pro�u�tion (A1 - A3)Constru�tion (A4 - A5)En� of Life (C1 - C4)A��itional Environmental InformationBefore using this product, it is recommended that the operator read and follow all caution statements on the product data sheet and on the SDS for this product, and personal protective equipment must be used as directed.Page 14 / 15
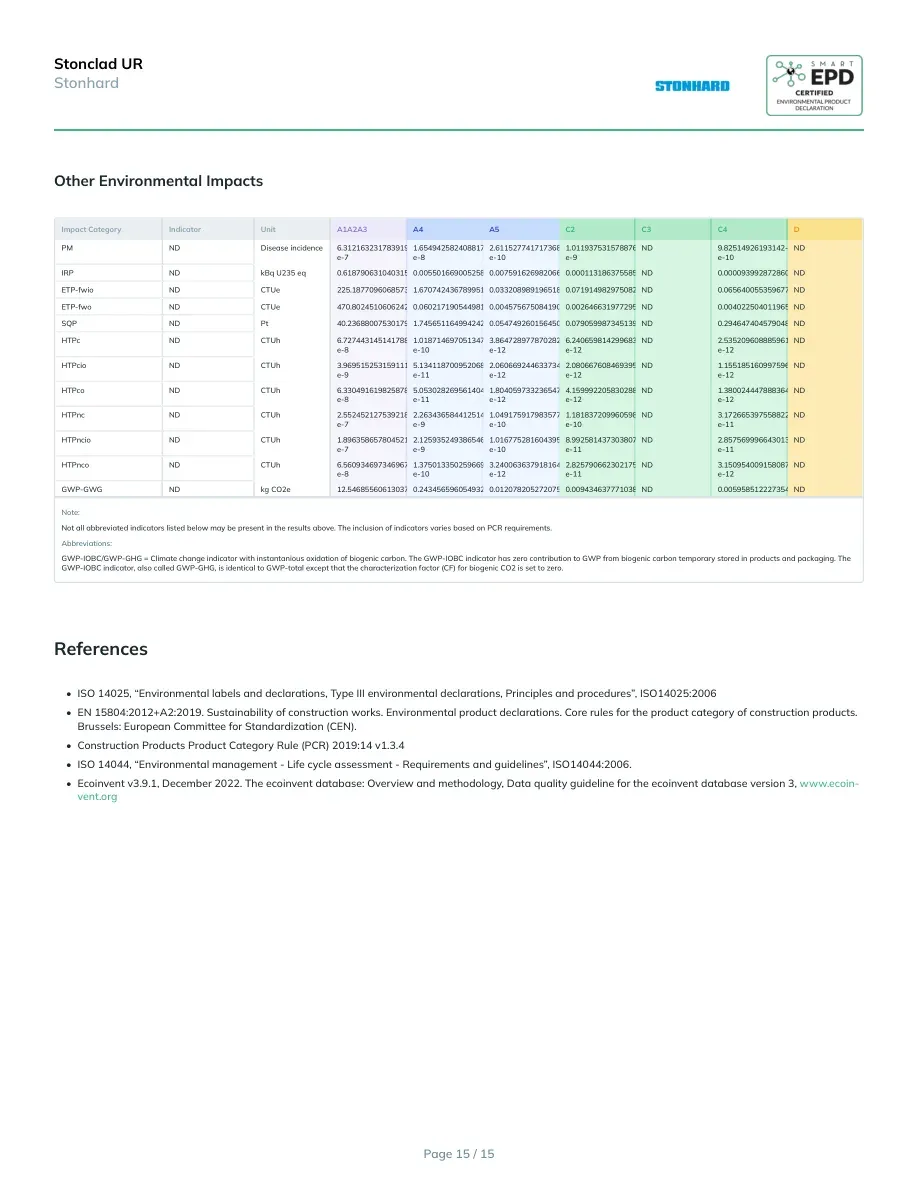
Ston�la� URStonhardOther Environmental Impa�tsImpa�t CategoryIn�i�atorUnitA1A2A3A4A5C2C3C4DPMNDDisease incidence6.312163231783919-e-71.654942582408817-e-82.611527741717368-e-101.0119375315788761-e-9ND9.82514926193142-e-10NDIRPNDkBq U235 eq0.61879063104031520.0055016690052588650.0075916269820663580.00011318637558566986ND0.00009399287286085412NDETP-fwioNDCTUe225.1877096068573 1.670742436789951 0.033208989196518320.07191498297508209ND0.06564005535967758NDETP-fwoNDCTUe470.802451060624260.0602171905449819660.00457567508419028450.0026466319772959932ND0.004022504011965605NDSQPNDPt40.23688007530179 1.74565116499424280.0547492601564507560.07905998734513939ND0.29464740457904837NDHTPcNDCTUh6.727443145141788-e-81.0187146970513472-e-103.8647289778702824-e-126.240659814299683-e-12ND2.535209608885961-e-12NDHTPcioNDCTUh3.9695152531591114-e-95.134118700952068-e-112.0606692446337348-e-122.0806676084693958-e-12ND1.1551851609975967-e-12NDHTPcoNDCTUh6.330491619825878-e-85.053028269561404-e-111.8040597332365477-e-124.159992205830288-e-12ND1.3800244478883648-e-12NDHTPncNDCTUh2.552452127539218-e-72.263436584412514-e-91.0491759179835771-e-101.181837209960598-e-10ND3.1726653975588224-e-11NDHTPncioNDCTUh1.8963586578045217-e-72.1259352493865467-e-91.0167752816043955-e-108.992581437303807-e-11ND2.857569996643013-e-11NDHTPncoNDCTUh6.560934697346967-e-81.3750133502596692-e-103.2400636379181643-e-122.825790662302175-e-11ND3.150954009158087-e-12NDGWP-GWGNDkg CO2e12.5468556061303720.243456596054932720.012078205272075210.009434637771038526ND0.0059585122273548875NDNote:Not all abbreviated indicators listed below may be present in the results above. The inclusion of indicators varies based on PCR requirements.Abbreviations:GWP-IOBC/GWP-GHG = Climate change indicator with instantanious oxidation of biogenic carbon. The GWP-IOBC indicator has zero contribution to GWP from biogenic carbon temporary stored in products and packaging. The GWP-IOBC indicator, also called GWP-GHG, is identical to GWP-total except that the characterization factor (CF) for biogenic CO2 is set to zero.Referen�es• ISO 14025, “Environmental labels and declarations, Type III environmental declarations, Principles and procedures”, ISO14025:2006• EN 15804:2012+A2:2019. Sustainability of construction works. Environmental product declarations. Core rules for the product category of construction products. Brussels: European Committee for Standardization (CEN).• Construction Products Product Category Rule (PCR) 2019:14 v1.3.4• ISO 14044, “Environmental management - Life cycle assessment - Requirements and guidelines”, ISO14044:2006.• Ecoinvent v3.9.1, December 2022. The ecoinvent database: Overview and methodology, Data quality guideline for the ecoinvent database version 3, www.ecoin-vent.orgPage 15 / 15
